
Decision Trees in Q: From Stump to Forest
Agenda
- Example
- History
- Algorithm
- Data Structure
- Extensions
- Visualization
- Summary
Canonical Example (data)
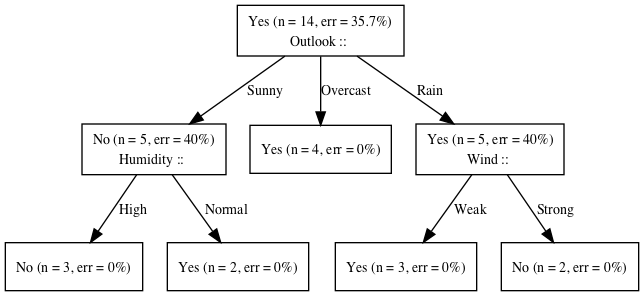
- To play or not to play?
q)\l funq.q
q)show t:`Play xcols (" SSSSS";1#",") 0: `:weather.csv
Play Outlook  Temperature Humidity Wind
-----------------------------------------
No   Sunny    Hot         High     Weak
No   Sunny    Hot         High     Strong
Yes  Overcast Hot         High     Weak
Yes  Rain     Mild        High     Weak
Yes  Rain     Cool        Normal   Weak
No   Rain     Cool        Normal   Strong
Yes  Overcast Cool        Normal   Strong
No   Sunny    Mild        High     Weak
Yes  Sunny    Cool        Normal   Weak
Yes  Rain     Mild        Normal   Weak
Yes  Sunny    Mild        Normal   Strong
Yes  Overcast Mild        High     Strong
Yes  Overcast Hot         Normal   Weak
No   Rain     Mild        High     Strong
Canonical Example (tree)
A Brief History of Decision Trees
- Automatic Interaction Detection (AID) 1963
- THeta Automatic Interaction Detection (THAID) 1972
- CHi-squared Automatic Interaction Detection (CHAID) 1980
- Classification And Regression Trees (CART) 1984
- Iterative Dichotomizer 3 (ID3) 1986
- C4.5 (Ross Quinlan) 1993
- Bootstrap AGgregating (BAG) 1996
- ADAptive BOOSTing (ADABOOST) 1997
- Random Forest 2001
- C5.0 (GPL version available) 2011
Choices
- Classification vs Regression
- Ordered vs Categorical data
- Splitting Criteria (Entropy/Gini/SSE)
- Pre/Post Pruning
- Null Values: Training and Classification/Regression
Algorithm
/ given a (t)able of classifiers and labels where the first column is
/ target attribute create a decision tree using the (c)ategorical
/ (g)ain (f)unction and (o)rdered (g)ain (f)unction.  the (s)plit
/ (f)unction decides what statistic to minimize.  pruning subtrees
/ with (m)inimum number of (l)eaves, and (m)ax (d)epth
dt:{[cgf;ogf;sf;ml;md;w;t]
 if[(::)~w;w:n#1f%n:count t];       / handle unassigned weight
 if[1=count d:flip t;:(w;first d)]; / no features to test
 if[not md;:(w;first d)];           / don't split deeper than max depth
 if[not ml<count a:first d;:(w;a)]; / don't split unless >min leaves
 if[all 1_(=':) a;:(w;a)];          / all values are equal
 d:(0N?key d)#d:1 _d;               / randomize feature order
 g:{[cgf;ogf;sf;w;x;y] $[isord y;ogf;cgf][sf;w;x;y]}[cgf;ogf;sf;w;a] peach d;
 if[all 0>=gr:first each g;:(w;a)]; / stop if no gain
 g:last b:1_ g ba:imax gr;          / best attribute
 / distribute nulls down each branch with reduced weight
 if[(c:count k)>ni:null[k:key g]?1b;w:@[w;n:g nk:k ni;%;c-1];g:(nk _g),\:n];
 if[null b 0;t:(1#ba)_t];           / don't reuse categorical classifiers
 b[1]:.z.s[cgf;ogf;sf;ml;md-1]'[w g;t g];   / classify subtree
 ba,b}
Splitting Criteria
- Different distributions of binary data
- Which row has the most information?
- Which row should a decision tree leaf look like?
q)show x:(0N?where@) each flip (reverse x;x:til 11)
0 0 0 0 0 0 0 0 0 0
0 1 0 0 0 0 0 0 0 0
0 0 1 1 0 0 0 0 0 0
1 0 0 0 0 0 0 1 1 0
0 1 0 1 0 1 0 0 1 0
1 1 0 1 0 1 1 0 0 0
0 1 0 1 1 1 1 0 0 1
1 0 1 1 1 1 0 0 1 1
1 0 1 1 0 1 1 1 1 1
1 1 1 1 1 1 1 1 0 1
1 1 1 1 1 1 1 1 1 1
Entropy (Information Gain)
- measure of information (lack of uncertainty)
\({-\sum p(x) \log_2 p(x)}\)
/ weighted odds
q).ml.odds:{[g]g%sum g:count each g}
q).ml.entropy:{neg sum x*2 xlog x:odds group x}
q).util.plot[19;10;" *"] .ml.entropy each x
1        | "       * * *       "
0.8888889| "     *       *     "
0.7777778| "   *           *   "
0.6666667| "                   "
0.5555556| "                   "
0.4444444| " *               * "
0.3333333| "                   "
0.2222222| "                   "
0.1111111| "                   "
0        | "*                 *"
Gini Impurity
- measure of misclassification
\({1-\sum p(x)p(x)}\)
q).ml.odds:{[g]g%sum g:count each g}
q).ml.gini:{1f-sum x*x:odds group x}
q).util.plot[19;10;" *"] .ml.gini each x
0.5       | "       * * *       "
0.4444444 | "     *       *     "
0.3888889 | "                   "
0.3333333 | "   *           *   "
0.2777778 | "                   "
0.2222222 | "                   "
0.1666667 | " *               * "
0.1111111 | "                   "
0.05555556| "                   "
0         | "*                 *"
SSE (Sum of Squared Errors)
- measure of deviation
\({\sum (x-\mu)^2}\)
q).ml.sse:{sum x*x-:avg x}
q).util.plot[19;10;" *"] .ml.sse each x
0.25      | "       * * *       "
0.2222222 | "     *       *     "
0.1944444 | "                   "
0.1666667 | "   *           *   "
0.1388889 | "                   "
0.1111111 | "                   "
0.08333333| " *               * "
0.05555556| "                   "
0.02777778| "                   "
0         | "*                 *"
Pruning
- Pre-Pruning (function parameters)
- Maximum Tree Depth
- Minimum Leaf Population
- Post-Pruning (algorithms)
- Cross Validation
- Pessimistic Error
Gain Functions
/ using a (s)plit (f)unction to compute the information gain
/ (optionally (n)ormalized by splitinfo) of x and y
gain:{[n;sf;w;x;y]
 g:sf[w] x;
 g-:sum wodds[w;gy]*(not null key gy)*w[gy] sf' x gy:group y;
 if[n;g%:sf[w] y];              / gain ratio
 (g;::;gy)}

/ set gain
sgain:{[sf;w;x;y]
 g:(gain[0b;sf;w;x] y in) peach u:cmb[0N] distinct y;
 g@:i:imax g[;0];               / highest gain
 g[1]:in[;u i];                 / split function
 g}

/ improved use of ordered attributes in c4.5 (quinlan) MDL
ogain:{[mdl;n;sf;w;x;y]
 g:(gain[0b;sf;w;x] y <) peach u:desc distinct y;
 g@:i:imax g[;0];               / highest gain (not gain ratio)
 g[1]:<[;avg u i+0 1];          / split function
 if[mdl;g[0]-:xlog[2;-1+count u]%count x];
 if[n;g[0]%:sf[w] ugrp g 2];    / convert to gain ratio
 g}
Decision Trees
/ given a (t)able of classifiers and labels where the first column is
/ target attribute, create a decision tree
aid:dt[sgain;ogain[0b;0b];wsse] / automatic interaction detection
id3:dt[gain[0b];gain[0b];wentropy;1;0W;::] / iterative dichotomizer 3
q45:dt[gain[1b];ogain[1b;1b];wentropy] / like c4.5 (but does not post-prune)
ct:dt[gain[0b];ogain[0b;1b];wgini]     / classification tree
rt:dt[gain[0b];ogain[0b;0b];wsse]      / regression tree
stump:dt[gain[0b];ogain[0b;1b];wentropy;1;1]
Tree Data Structure
q) .ml.id3 t
`Outlook
::
`Sunny`Overcast`Rain!((`Humidity;::;`High`Normal!((0.07142857 0.07142857 0.07..
q)last  .ml.id3 t
Sunny   | (`Humidity;::;`High`Normal!((0.07142857 0.07142857 0.07142857;`No`N..
Overcast| (0.07142857 0.07142857 0.07142857 0.07142857;`Yes`Yes`Yes`Yes)
Rain    | (`Wind;::;`Weak`Strong!((0.07142857 0.07142857 0.07142857;`Yes`Yes`..
Adaboost
- Ensemble of Weak Learners (ie: Decision Stump)
- Serially Adapts Observation Weights
/ (t)rain (f)unction, (c)lassifier (f)unction, (t)able,
/ (alpha;model;weights)
adaboost:{[tf;cf;t;amw]
 w:last amw;
 m:tf[w] t;                     / train model
 yh:cf[m] each t;               / predict
 e:sum w*not yh=y:first flip t; / weighted error
 a:.5*log (1f-e)%e;             / alpha
 w*:exp neg a*y*yh;             / up/down weight
 w%:sum w;                      / scale
 (a;m;w)}

q)t:update -1 1 `Yes=Play from t
q)r:1_  20 .ml.adaboost[.ml.stump;.ml.dtc;t]\(0w;();n#1f%n:count t)
q)avg t.Play=signum sum r[;0] * signum r[;1] .ml.dtc/:\: t
1f
Random Forest
- Ensemble of Decision Trees
- Randomly Samples Observations and Features
- Handles Large Training Sets
/ Bootstrap AGgregating
bag:{[b;f;t](f ?[;t]@) peach b#count t}
/ Random FOrest
rfo:{[b;p;f;t]bag[b;(f{0!(x?1_cols y)#/:1!y}[p]@);t]}

q)m:.ml.rfo[10;floor sqrt count cols iris;.ml.q45[2;0W;::]] iris
q)avg iris.species=.ml.mode each m .ml.dtc\:/: iris
0.96
Visualization (console)
q)\l iris.q
q)10?iris.t
species         slength swidth plength pwidth
---------------------------------------------
Iris-versicolor 6.1     2.8    4       1.3
Iris-versicolor 6.1     2.9    4.7     1.4
Iris-virginica  5.7     2.5    5       2
Iris-virginica  7.7     2.8    6.7     2
Iris-setosa     5       3.3    1.4     0.2
Iris-setosa     5.3     3.7    1.5     0.2
Iris-versicolor 6       3.4    4.5     1.6
Iris-virginica  6.4     3.1    5.5     1.8
Iris-versicolor 5.7     2.8    4.5     1.3
Iris-versicolor 6.8     2.8    4.8     1.4
q)-1 .ml.ptree[0] .ml.q45[2;3;::] iris.t;
root: Iris-virginica (n = 150, err = 66.7%)
|  pwidth <[;0.8] 0: Iris-virginica (n = 100, err = 50%)
|  |  pwidth <[;1.75] 0: Iris-virginica (n = 46, err = 2.2%)
|  |  |  plength <[;4.85] 0: Iris-virginica (n = 43, err = 0%)
|  |  |  plength <[;4.85] 1: Iris-virginica (n = 3, err = 33.3%)
|  |  pwidth <[;1.75] 1: Iris-versicolor (n = 54, err = 9.3%)
|  |  |  plength <[;4.95] 0: Iris-virginica (n = 6, err = 33.3%)
|  |  |  plength <[;4.95] 1: Iris-versicolor (n = 48, err = 2.1%)
|  pwidth <[;0.8] 1: Iris-setosa (n = 50, err = 0%)
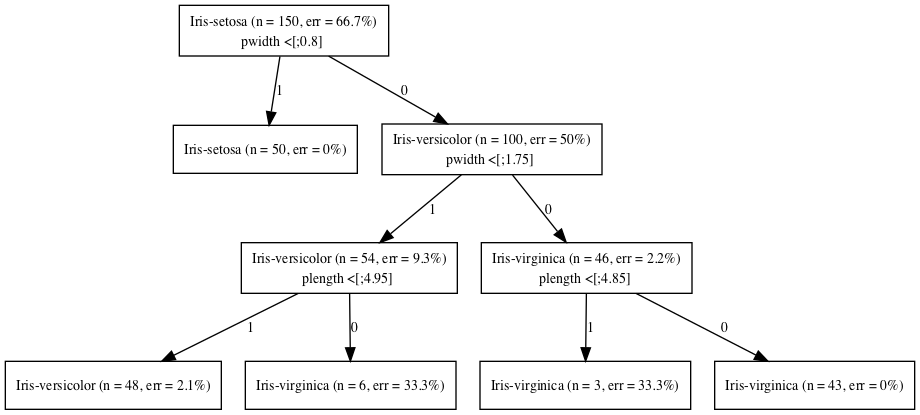
Visualization (graphviz input)
q)\l iris.q
q)-1 .ml.pgraph .ml.q45[2;3;::] iris.t;
digraph Tree {
node [shape=box] ;
0 [label="Iris-setosa (n = 150, err = 66.7%)\npwidth <[;0.8] "] ;
1 [label="Iris-setosa (n = 50, err = 0%)"] ;
0 -> 1 [label="1"] ;
2 [label="Iris-versicolor (n = 100, err = 50%)\npwidth <[;1.75] "] ;
0 -> 2 [label="0"] ;
3 [label="Iris-versicolor (n = 54, err = 9.3%)\nplength <[;4.95] "] ;
2 -> 3 [label="1"] ;
4 [label="Iris-versicolor (n = 48, err = 2.1%)"] ;
3 -> 4 [label="1"] ;
5 [label="Iris-virginica (n = 6, err = 33.3%)"] ;
3 -> 5 [label="0"] ;
6 [label="Iris-virginica (n = 46, err = 2.2%)\nplength <[;4.85] "] ;
2 -> 6 [label="0"] ;
7 [label="Iris-virginica (n = 3, err = 33.3%)"] ;
6 -> 7 [label="1"] ;
8 [label="Iris-virginica (n = 43, err = 0%)"] ;
6 -> 8 [label="0"] ;
}
Visualization (graphviz output)
dot -Tpng tree.dot > iris.png
Summary
- Started with ID3 (unordered data)
- Implemented C4.5 (ordered and null data)
- Added ability to specify weight vector
- Implemented AdaBoost
- Implemented Random Forest
- Added tree visualization (text and graphviz)
- TODO: optimize memory utilization
Source Code
bash-3.2$ git clone https://github.com/psaris/funq.git
bash-3.2$ cd funq
bash-3.2$ q decisiontree.q -s 4
KDB+ 3.6 2018.05.17 Copyright (C) 1993-2018 Kx Systems
m32/ 4()core 8192MB nick nicksmacbookpro.fios-router.home 192.168.1.156 NONEXPIRE

downloading iris data set
"http://archive.ics.uci.edu/ml/machine-learning-databases/iris/iris.data"
load weather data, remove the day column and move Play to front
Play Outlook  Temperature Humidity Wind
-----------------------------------------
No   Sunny    Hot         High     Weak
No   Sunny    Hot         High     Strong
Yes  Overcast Hot         High     Weak
Yes  Rain     Mild        High     Weak
...